

Earth1Water
A global framework for integrated water cycle modeling — developed and operated by Aquanty Inc.
Built on decades of hydrological innovation, Earth1Water combines Aquanty’s industry-leading technologies — including HydroGeoSphere, HGSRT, and HydroSphereAI with global datasets, advanced hydrologic modeling, and climate drivers to deliver reliable water cycle insights anywhere in the world.
Why Earth1Water Matters
Water is a shared global challenge — and a shared global opportunity. Earth1Water is designed to accelerate the science, data, and tools needed to secure water resources in a changing climate. By modeling proven national-scale projects like Canada1Water developing nations can access advanced forecasting and climate intelligence at a fraction of the cost of developing similar systems in-house.
By providing scalable, adaptable solutions, Earth1Water empowers nations, communities, and industries to plan for resilience and align with the UN Sustainable Development Goals.

How it Works
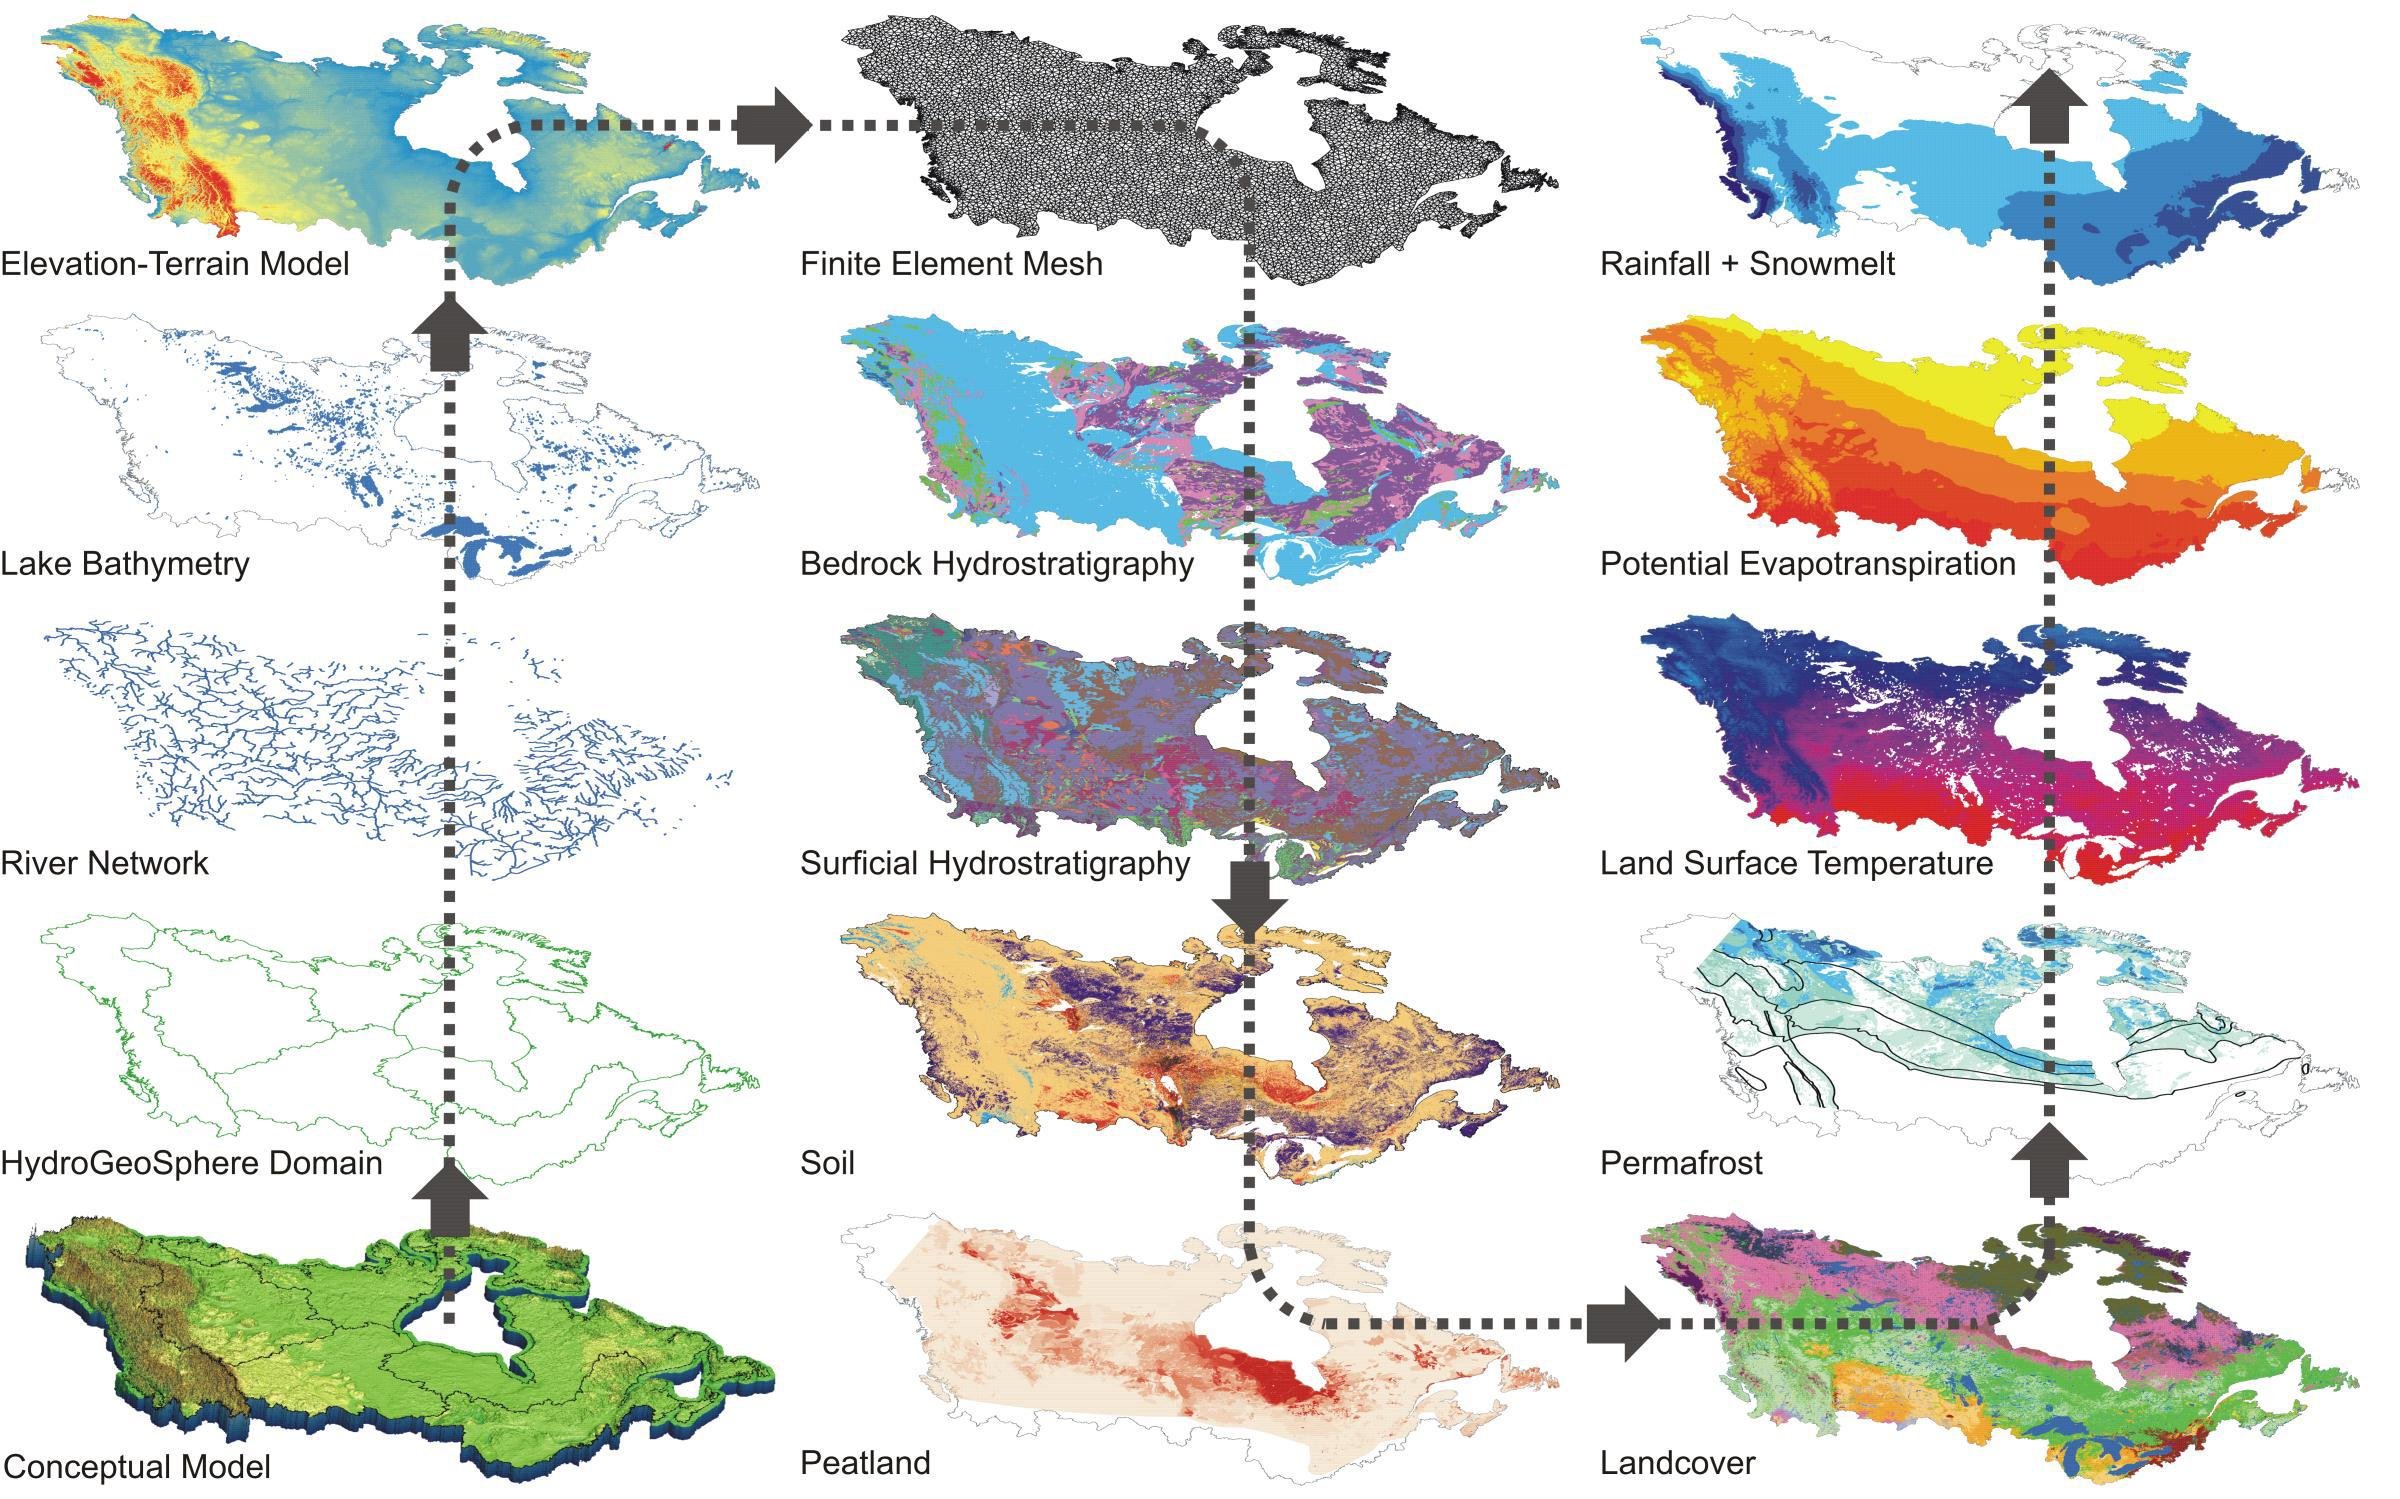
Earth1Water provides the foundation for building detailed, region-specific hydrologic models anywhere in the world. Using a physics-based approach, we integrate groundwater, surface water, climate drivers and land processes into a single, connected framework.
The result: decision-support tools that are adaptable from island nations to entire continents, giving governments, researchers and communities the insights they need to manage water resources with confidence.
What Earth1Water Can Do for You
Earth1Water provides governments, researchers, and organizations with the tools and data they need to make confident, evidence-based decisions about water.

-
Develop national water strategies and infrastructure plans informed by high-resolution modelling and climate projections.
-
Collaborate on integrated modelling studies and access harmonized data for hydrologic, climate, and groundwater–surface water interactions.
-
Leverage 1Water outputs to support community resilience, food security, and sustainable development goals.
-
Integrate physics-based hydrologic models into engineering design, resource planning, and environmental assessments.
Earth1Water delivers a unified, science-based foundation for understanding and managing the complete water cycle — wherever you are in the world.
Join the 1Water Network
Partner with us to bring 1Water modeling to your region.
Past Success
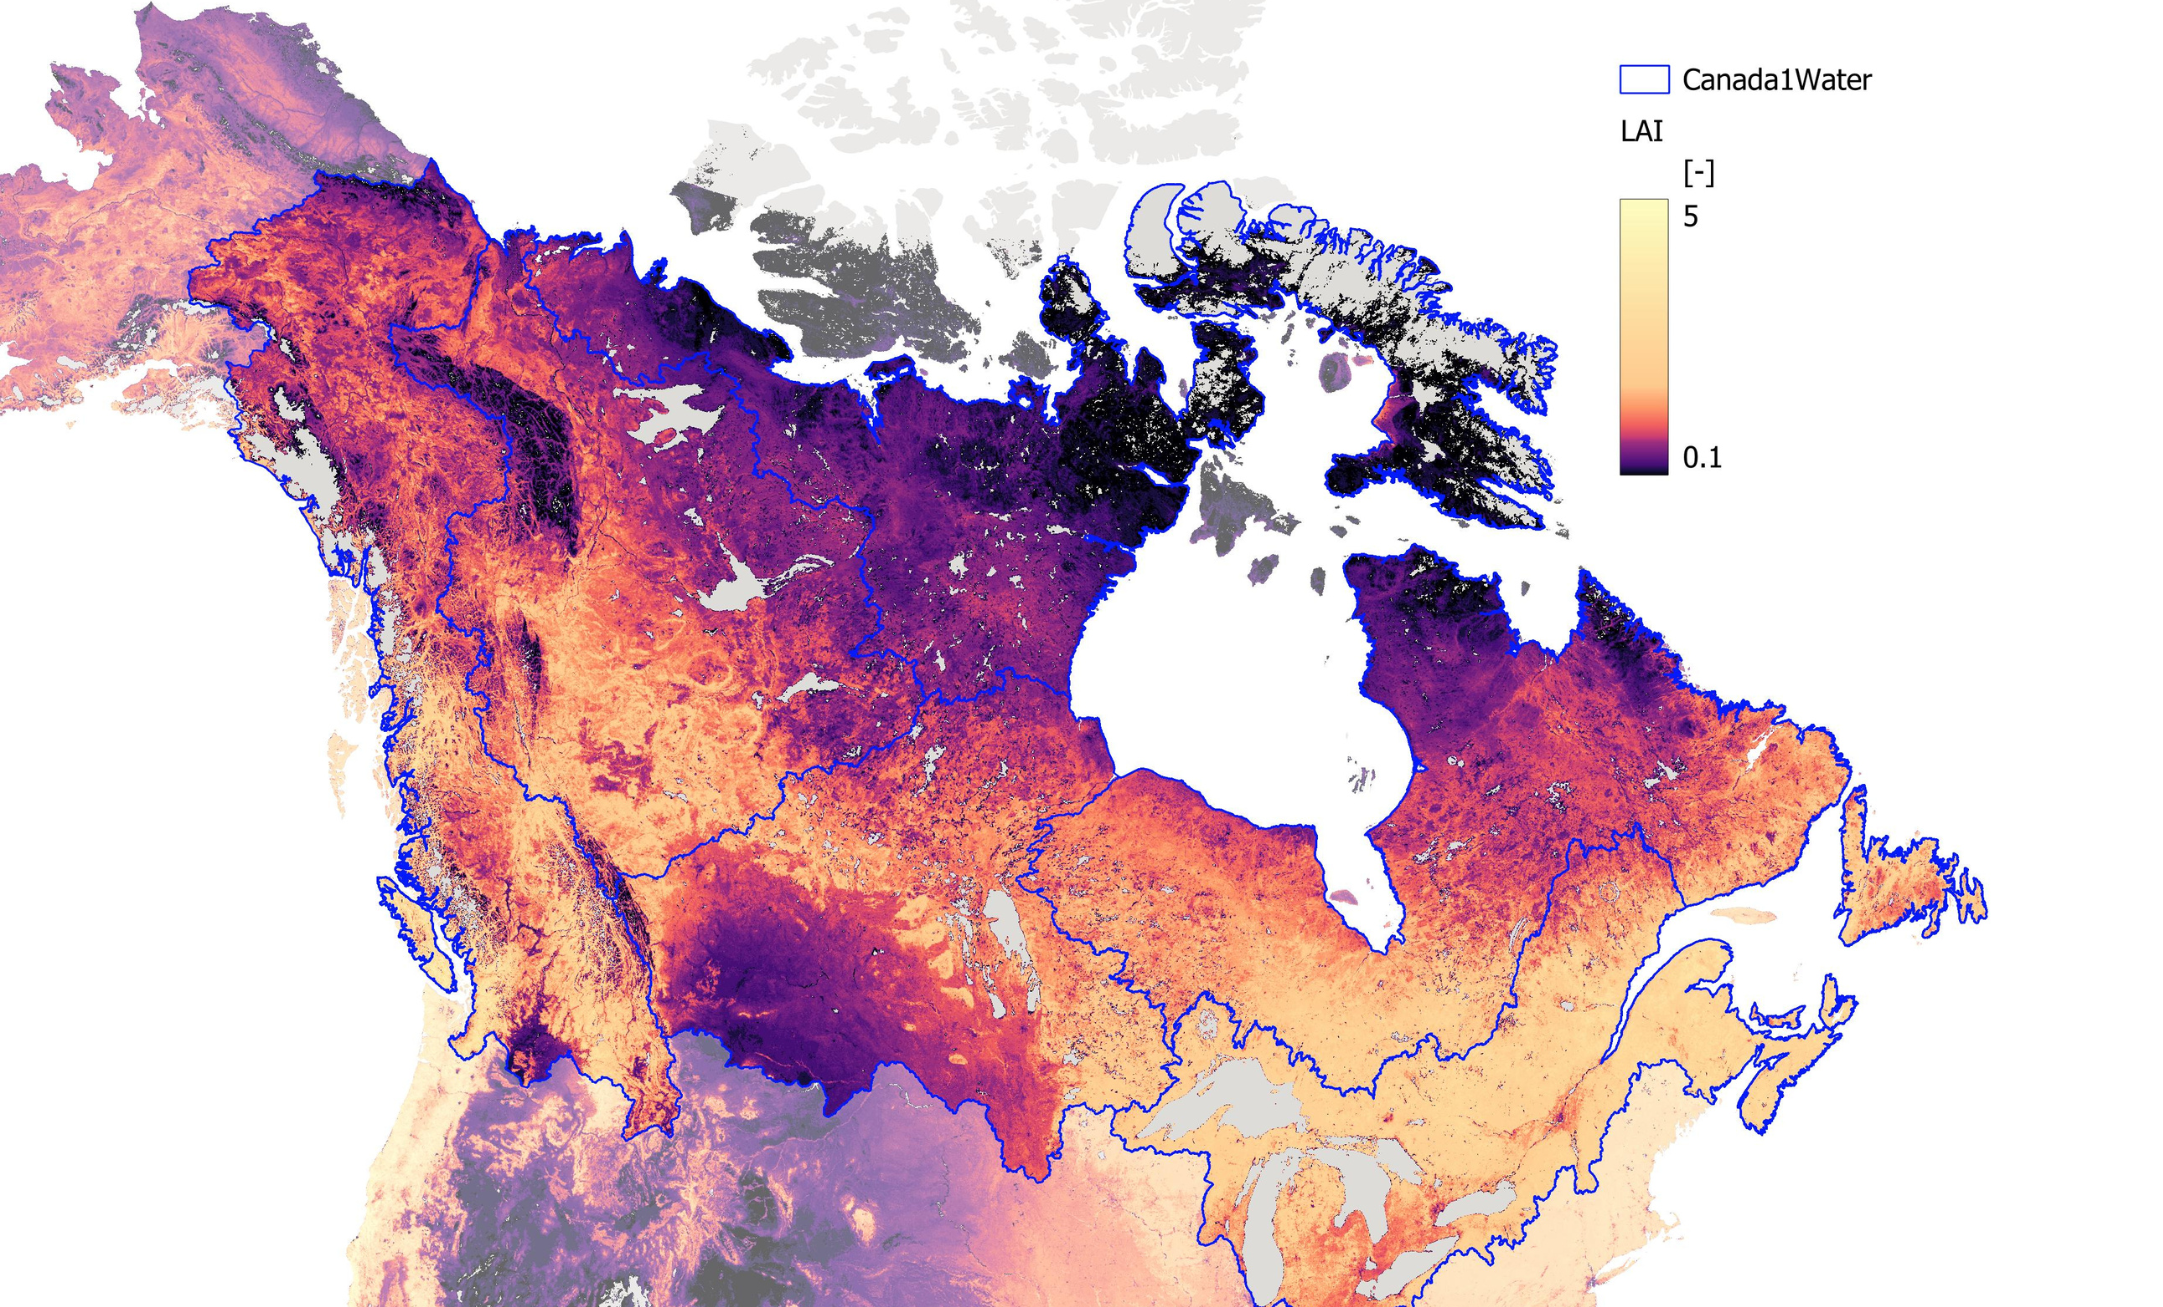
Canada1Water
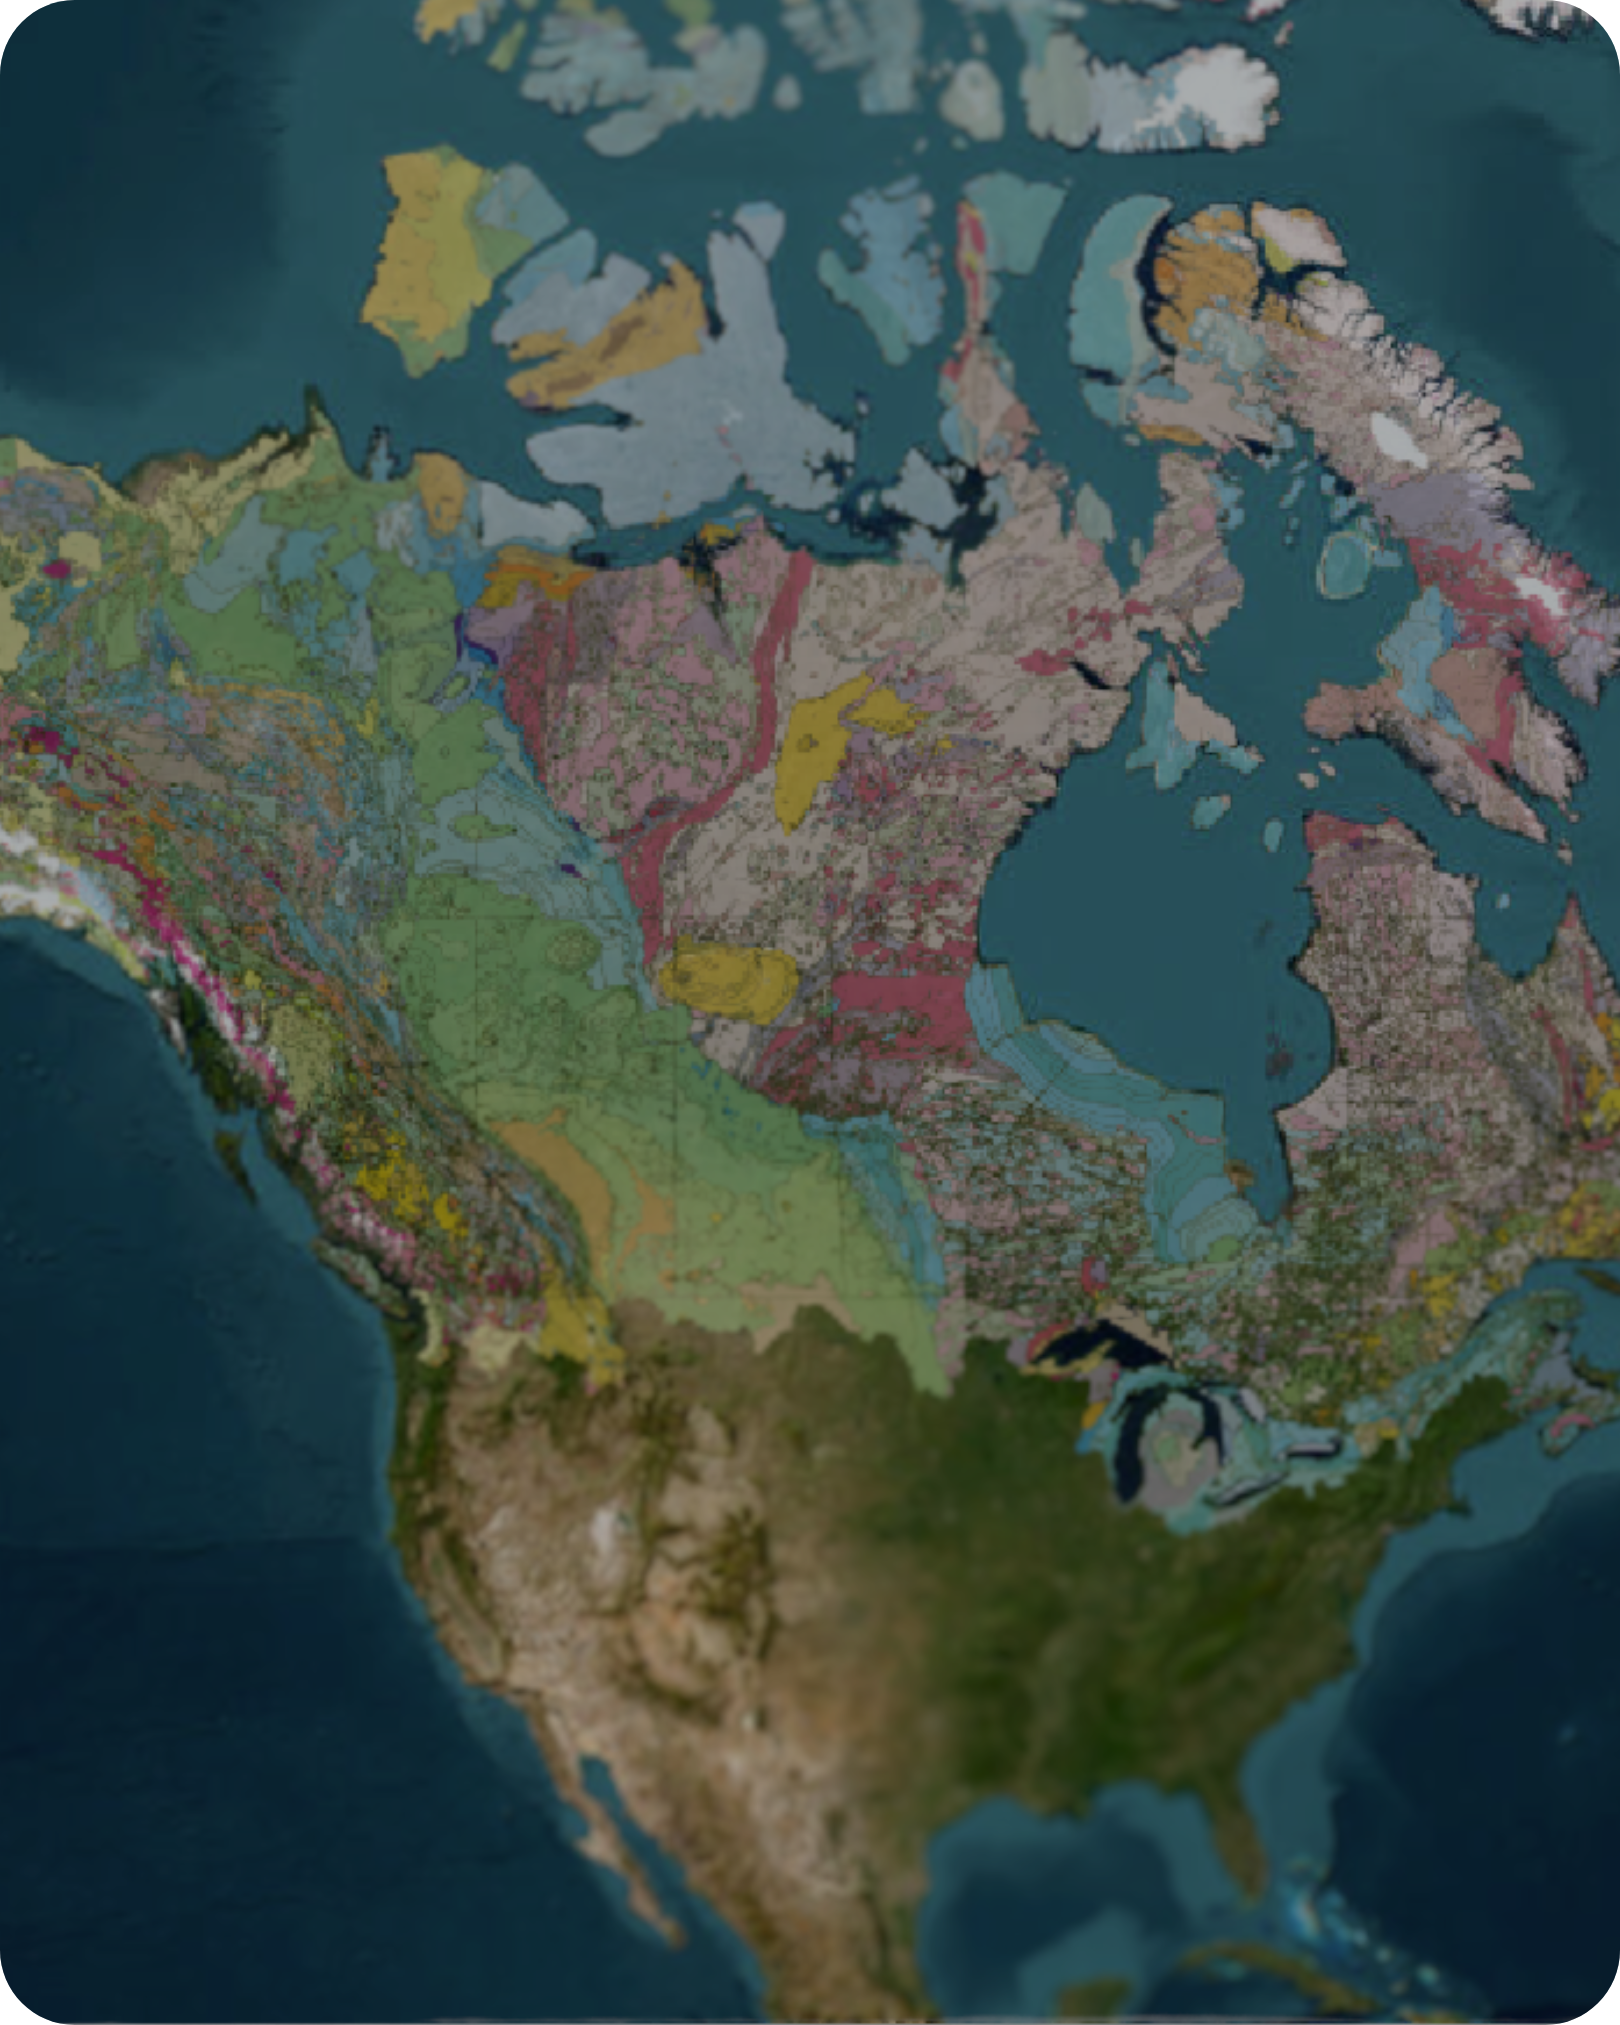
The first continental-scale, fully integrated hydrological model of Canada — delivering open data and forecasts that inform water security and climate resilience strategies nationwide.
Use Cases
The choices we make about water use today will have lasting impacts on health, the environment, and economic prosperity worldwide. Earth1Water brings together advanced hydrologic science, climate modeling, and data visualization into a unified platform designed to help nations adapt to a changing climate and secure sustainable water futures.
Predicting Floods, Droughts and Extreme Events
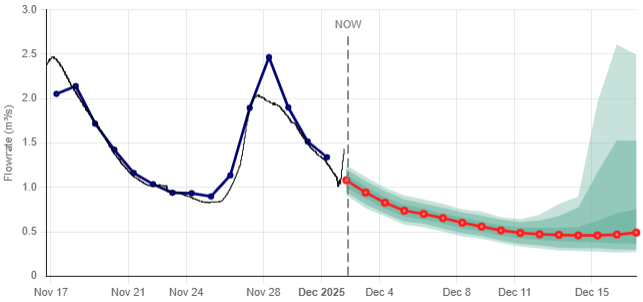
Earth1Water supports real-time and seasonal water forecasting, giving users the ability to anticipate and respond to changing conditions.
From flood warnings in large river basins to drought monitoring in vulnerable agricultural regions, our forecasting tools help communities prepare for extremes and manage resources more effectively.
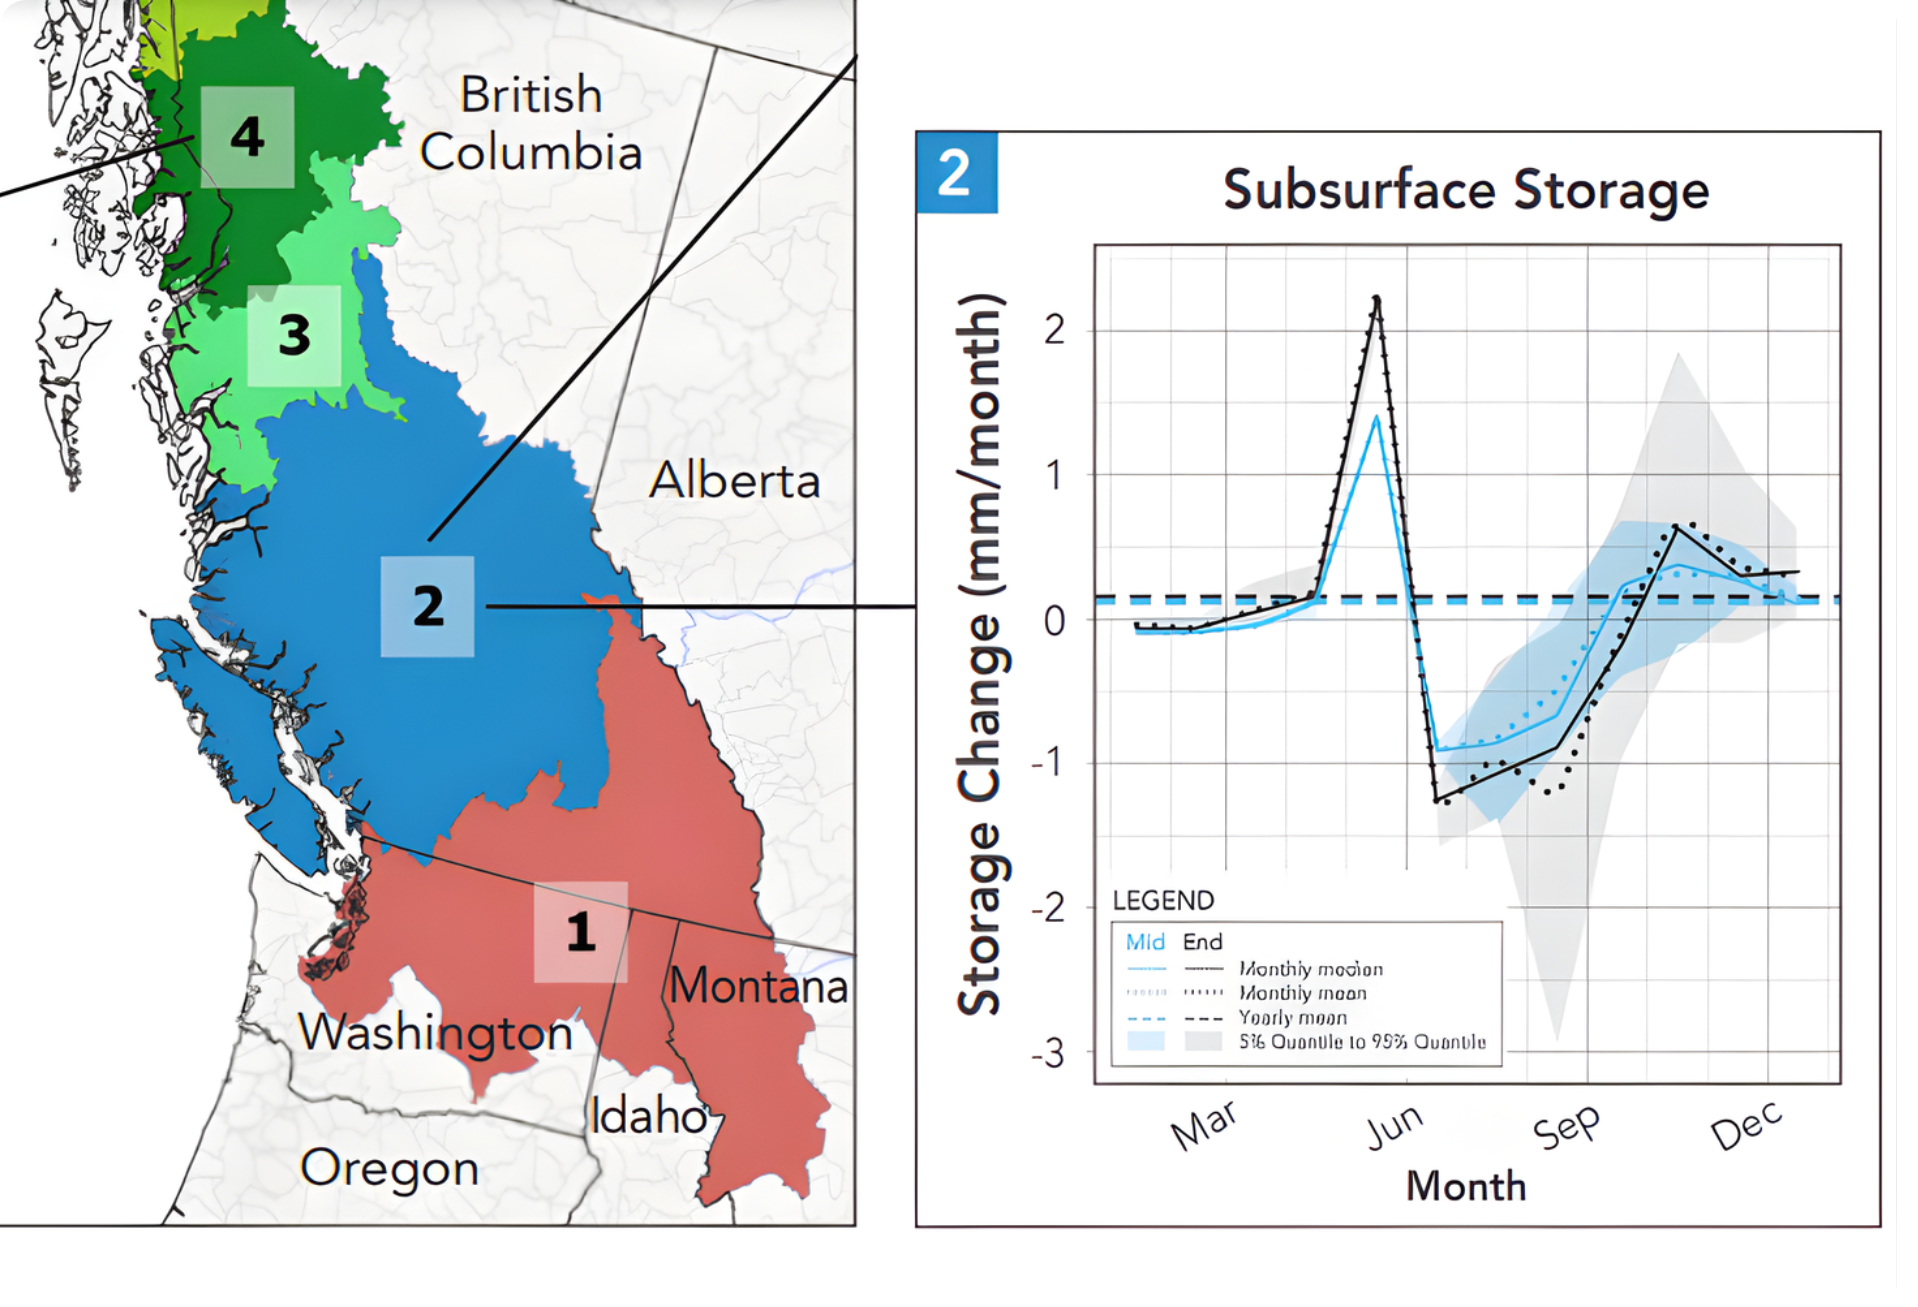
Climate Scenarios for Long-Term Water Resources Planning
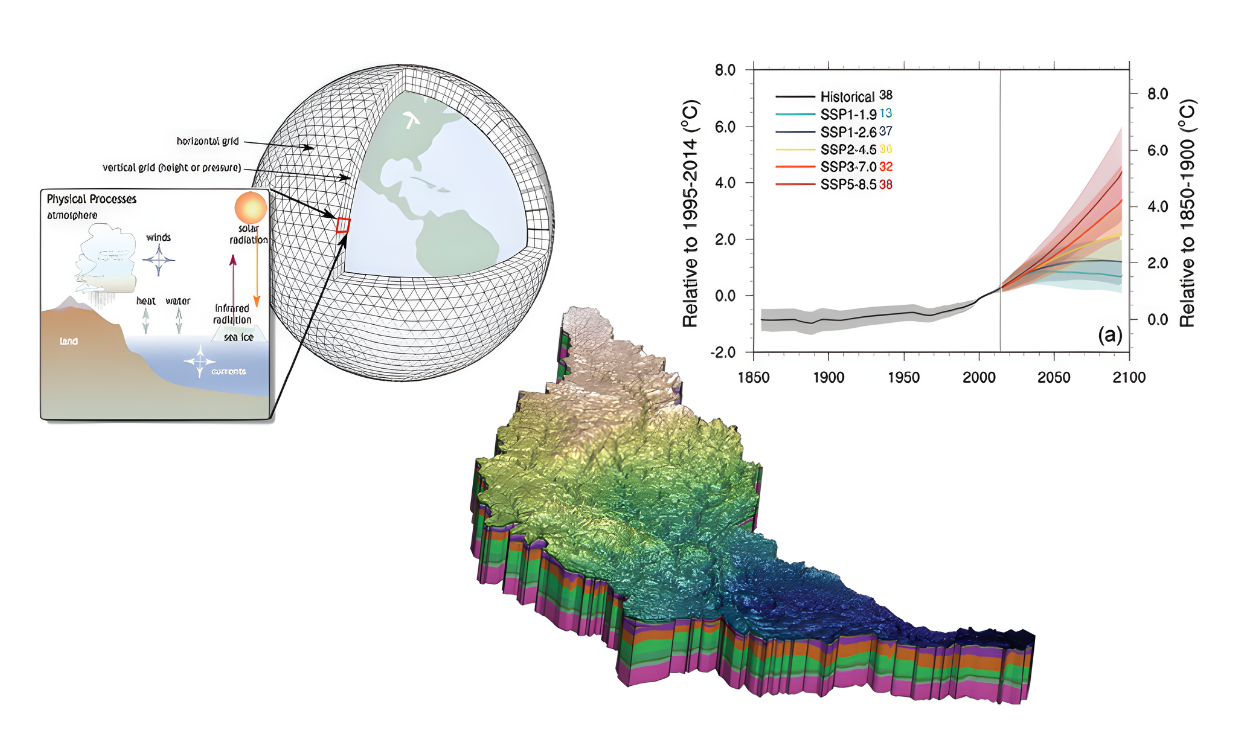
Climate change is reshaping the global water cycle. Earth1Water makes it possible to simulate how different climate scenarios will affect regional water availability, groundwater recharge, and surface water dynamics.
These simulations provide decision-makers with clear, actionable insights for adapting infrastructure, protecting ecosystems, and safeguarding water supplies against future uncertainty.
A Comprehensive Data Framework to Support Water Management at any Scale
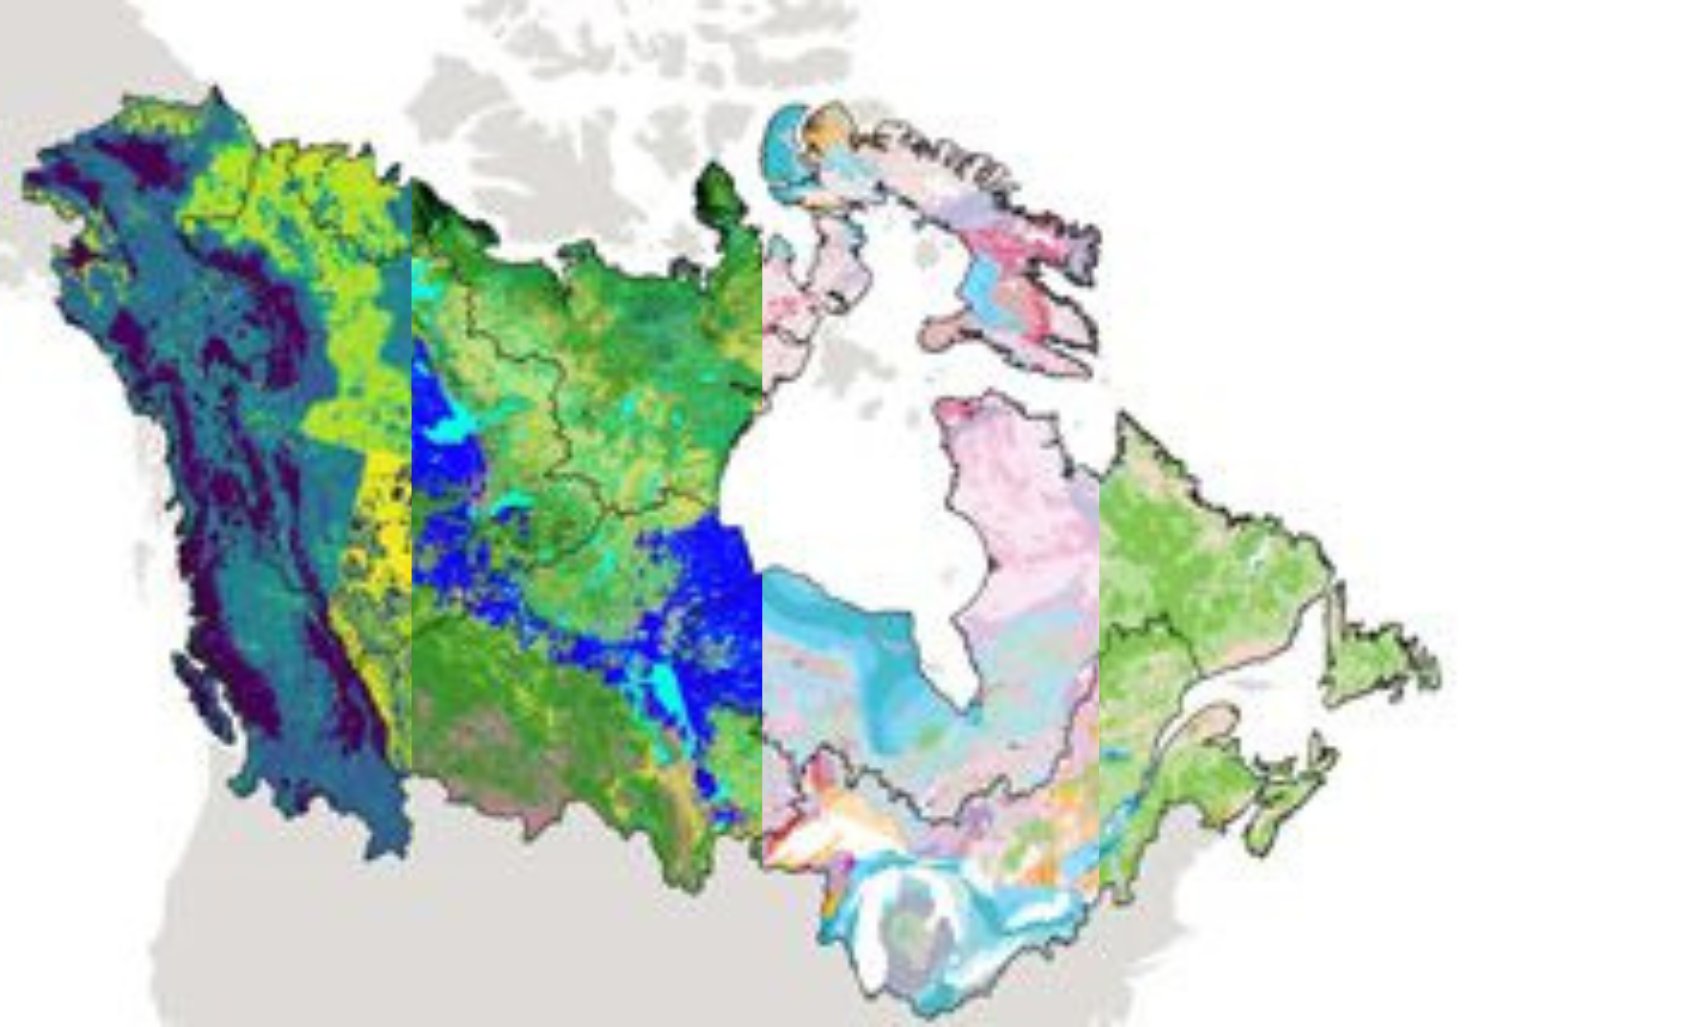
In addition to forecasts, Earth1Water generates a range of static data products — from long-term climate data and soil moisture maps to groundwater recharge and surface water outflows.
These open-access datasets offer a reliable foundation for scientific research, planning, and sustainable water management.
Our 4-Step Process
Our framework follows a transparent, repeatable process:
Geographical data compilation & refinement
Harmonizing hydrologic, geospatial, and climate inputs for each region.
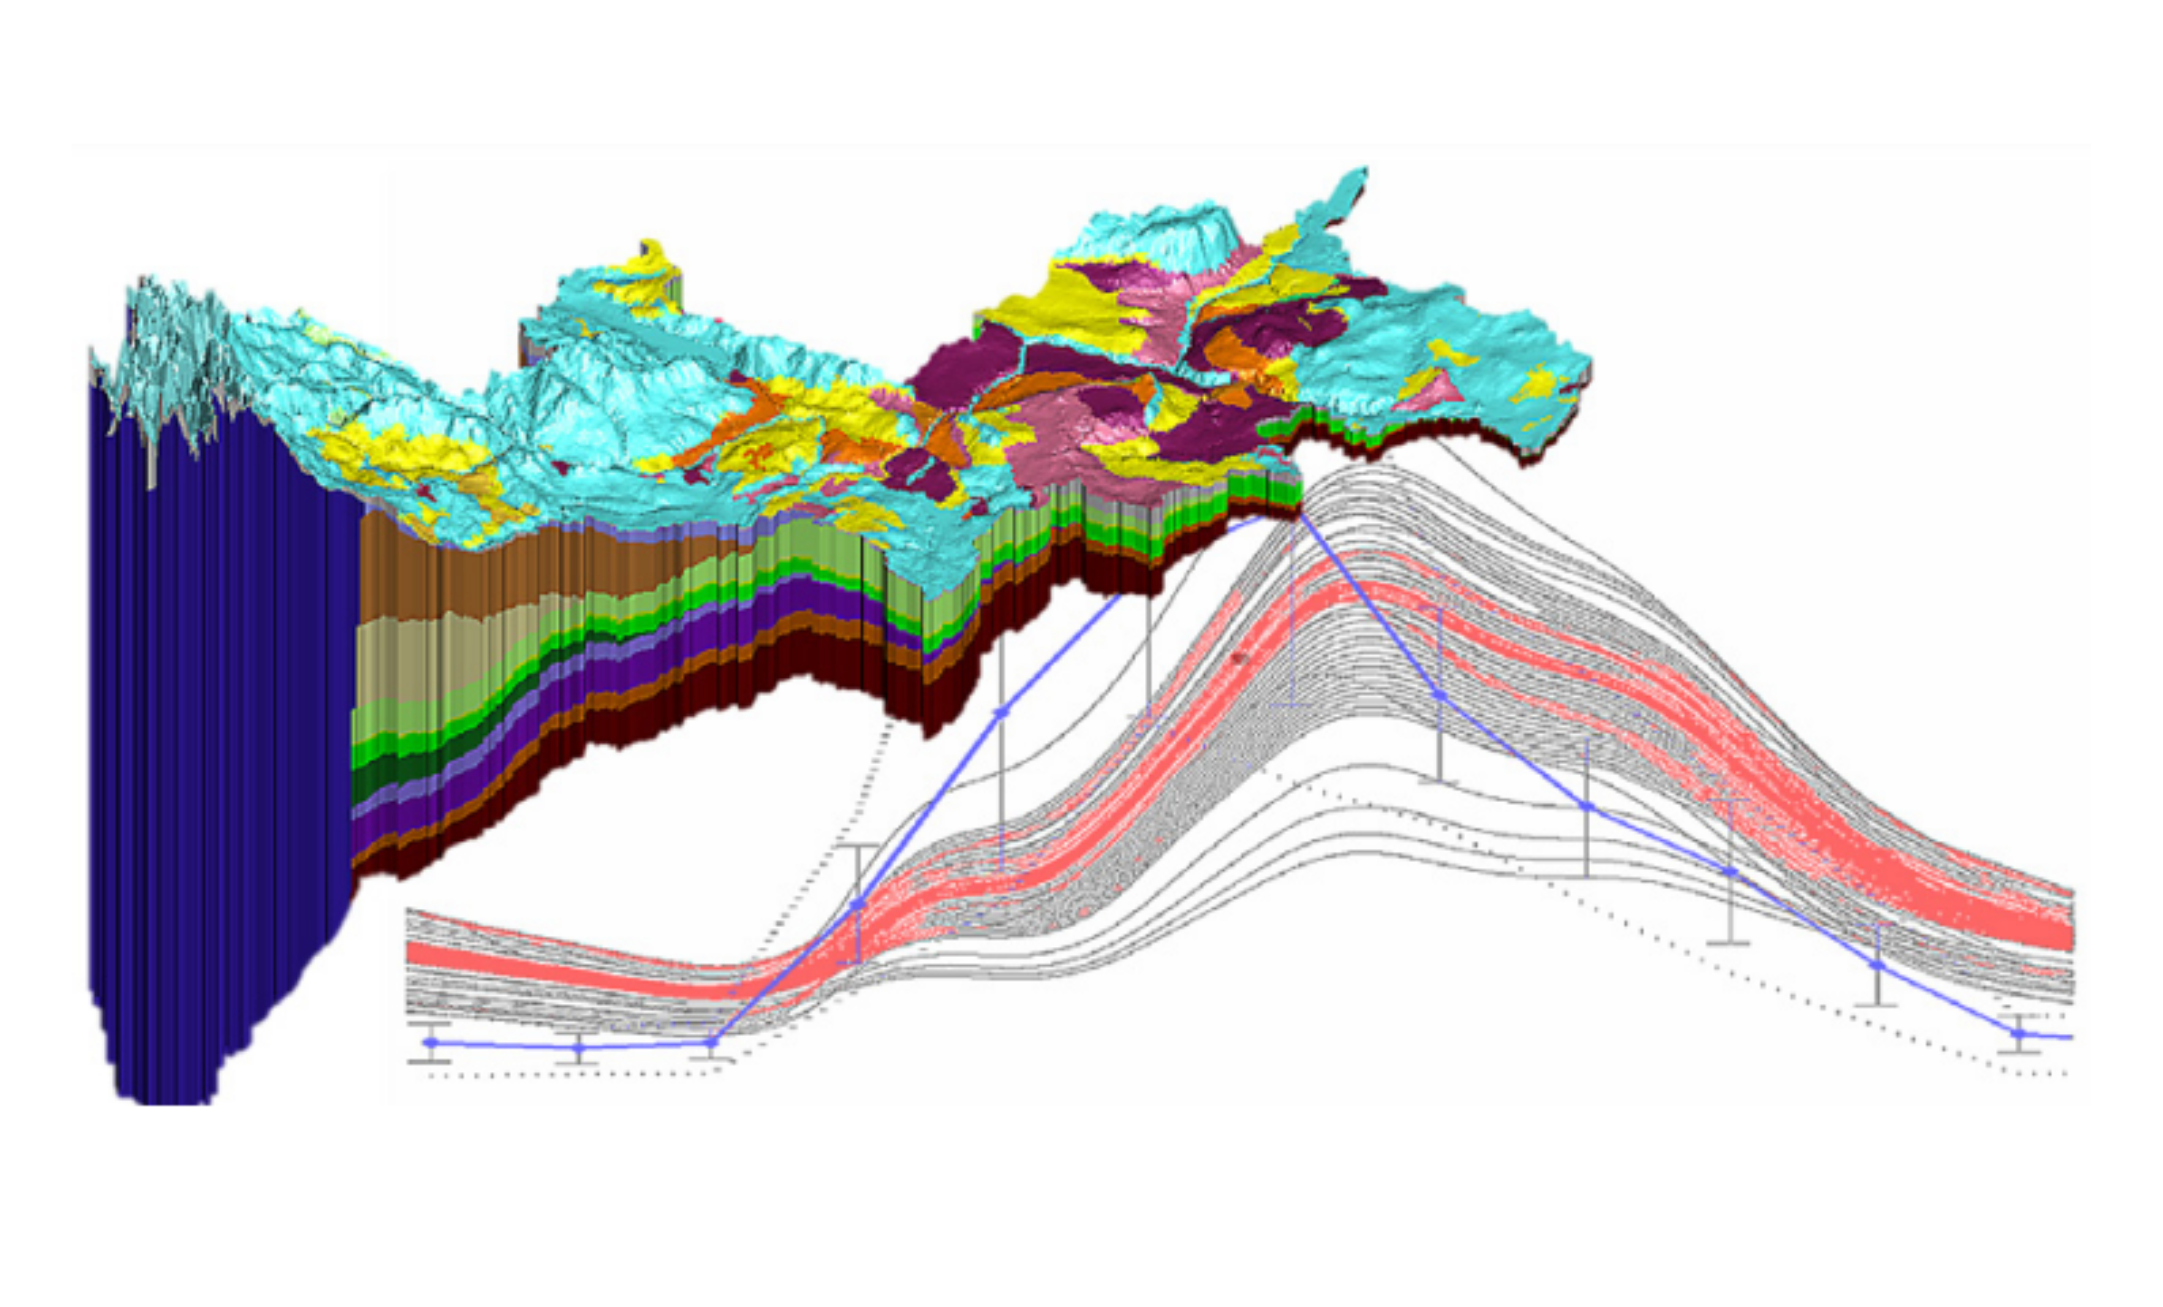
Model construction & validation
Building physics-based hydrologic models tailored to regional conditions.
Forcing data compilation & adjustment
Integrating meteorological forcing, climate projections, and human water use impacts.
Data dissemination & visualization
Delivering results through accessible datasets, interactive maps, and forecasting tools.
What’s your use case?
If you think Earth1Water could help support your water management decisions, we’d love to hear from you.